Client Information Configuration
It’s recommended that you add specific traits about your GraphQL clients to the Service configuration by capturing HTTP headers or JWT token claims. This will enable detailed filtering and grouping of query metrics, allowing for more helpful information to be captured about the active GraphQL clients, specifically:
- User/Client ID
- Organization ID
- Client Info/User Agent
- Client IP Address
In the Service configuration, there are various _path configurations that can be used to capture GraphQL client information.
Example JWT Token
The following is an example of a JWT token payload that has email and org_name claims that can use used for the purposes of identifying the GraphQL client:
{
  "sub": "1234567890",
  "iat": 1516239022,
  "email": "[email protected]",
  "org_name": "acme"
}
Example Service Configuration
The following example shows how the Inigo Service can be customized to extract relevant HTTP headers and JWT claims that can be used to add more detail to the captured query metrics:
kind: Service
name: graphql-gateway
spec:
  path_user_id: jwt.email
  path_organization_id: jwt.org_name
  path_client_info: "header.User-Agent"
  path_client_address: "header.X-Forwarded-For"
Using the Inigo CLI, this updated Service YAML can be applied using inigo apply with the YAML file name, as shown in the following example:
inigo apply inigo-configs/01-service.yaml --label dev
After applying the updated Service configuration, Inigo will capture any GraphQL queries run with the configured HTTP headers and/or JWT claims. Figure 1 shows the query details, which show the User ID, Organization, Client, and Client IP populated:
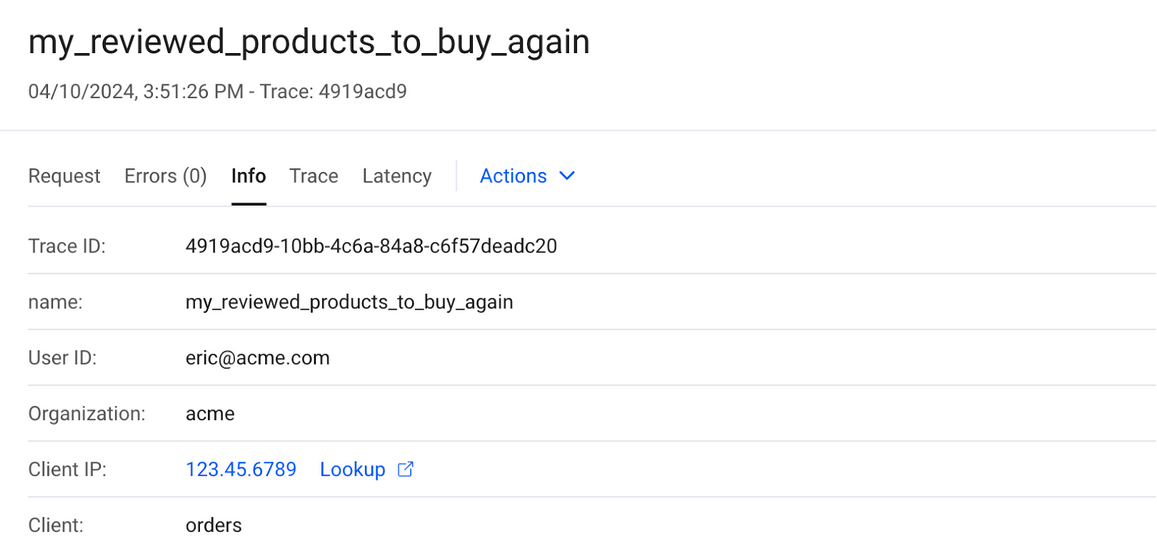
Figure 1. GraphQL query metrics with client configuration set.
The Headers can be set to run the queries using Inigo Explorer with the appropriate client values, as shown in Figure 2.
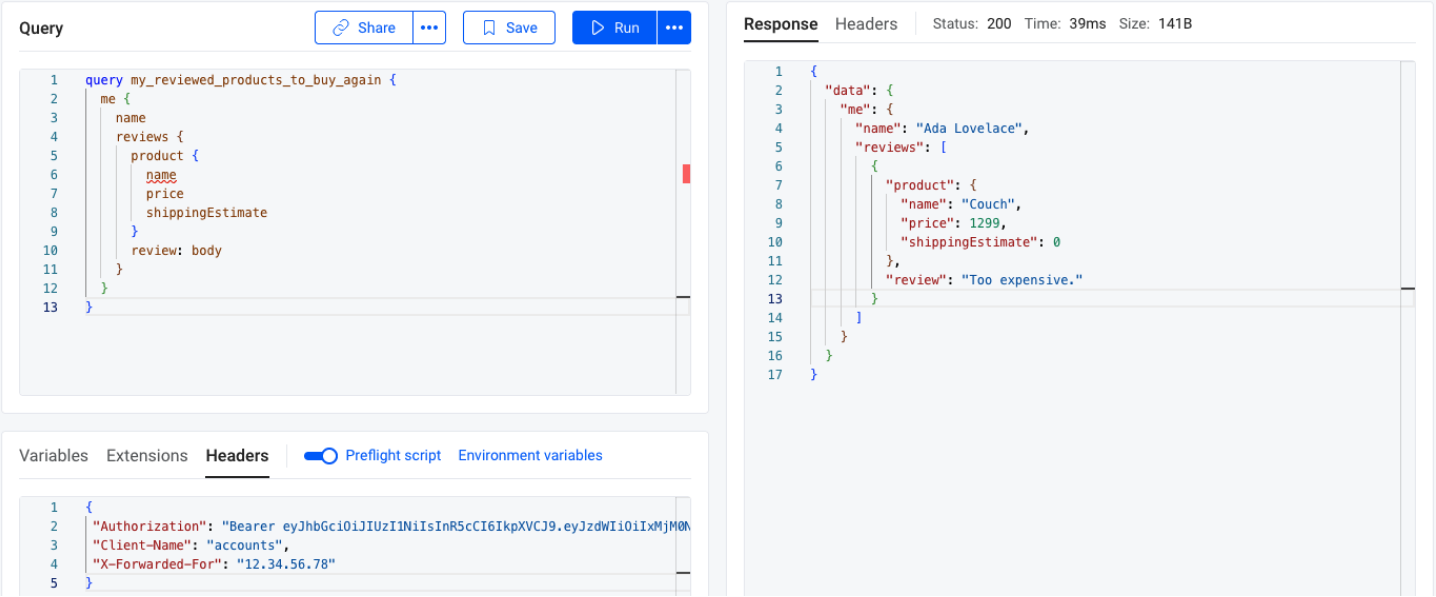
Figure 2. Using Explorer to run a query with Headers.
After running queries with various Users, Clients, and Organizations, it can be helpful to Group by the queries in Observe, as shown in Figure 3-5.
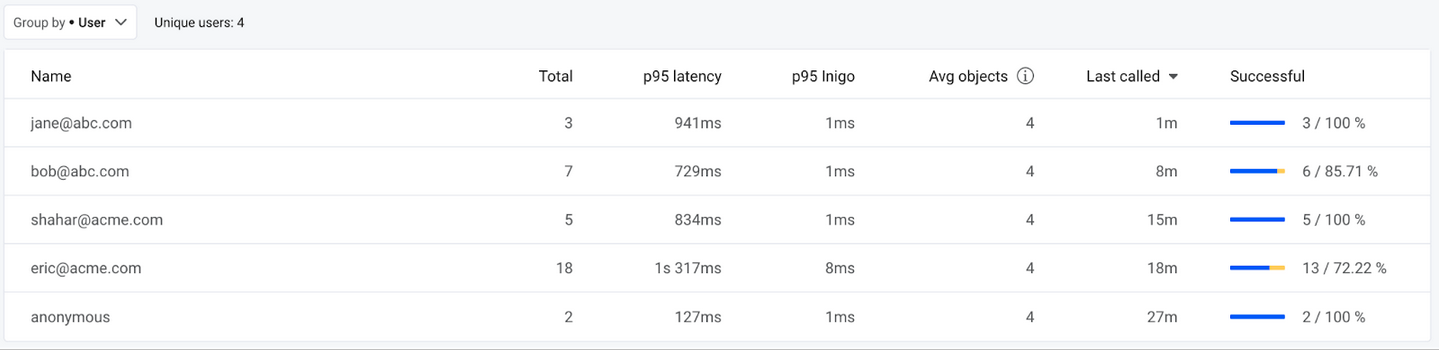
Figure 3. Group by User.
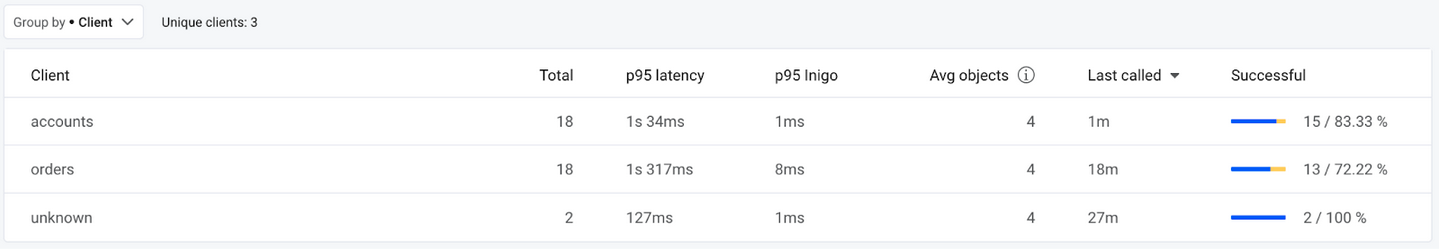
Figure 4. Group by Client.
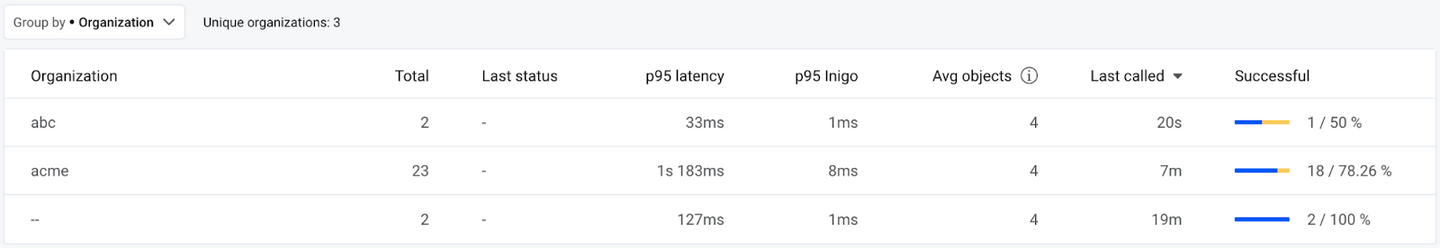
Figure 5. Group by Organization.
Configuring the GraphQL client information enables deeper observation of queries, errors, and performance issues that may only impact specific Users, Clients, or Organizations.