Part 1: Inigo in 15 Minutes
Once you have created your account and have your Inigo service token, you can experience Inigo and its capabilities in only 15 minutes! In this tutorial, you will learn how to install and configure Inigo and execute GraphQL queries that will produce results in Inigo's Observability.
Our Star Wars Demo Application, built with Apollo Server, includes a Star Wars GraphQL schema with sample data. Prior knowledge of Apollo Server is not required, but you must have Node and npm installed, in addition to git.
This tutorial is based on Apollo Server, if you use a different GraphQL server, follow along and check out our other agent installation options:
- Standalone Agent
- Apollo Server
- Apollo Gateway
- Apollo Router
- Python Django
- Python Flask
- Kubernetes Sidercar
- AWS AppSync
Get the Star Wars Demo Application
The Star Wars Demo Application is located on GitHub at github.com/inigolabs/workshops/tree/main/starwars-demo
You should execute the following commands on your local machine to git clone the repository and cd into it.
git clone https://github.com/inigolabs/workshops
cd workshops/starwars-demo
1. Install the Inigo Agent
Inigo requires the installation of an agent that securely calls back to the Inigo control plane. This agent runs as an Apollo Server plug-in that intercepts GraphQL queries and forwards data needed by Inigo. By following the installation steps here, you will become familiar with how Inigo works for any type of GraphQL deployment, not just Apollo Server.
To get the Star Wars Demo Application working with Inigo, the following steps must be completed:
Install the inigo.js Package
npm install inigo.js
Install the Inigo Agent Package
Pick from the following options, depending on your runtime environment:
Linux Intel or AMD
npm install inigo-linux-amd64
Linux ARM
npm install inigo-linux-arm64
macOS Intel
npm install inigo-darwin-amd64
macOS ARM (M1, M2, M3)
npm install inigo-darwin-arm64
Windows Intel or AMD
npm install inigo-windows-amd64
Add the InigoPlugin for Apollo Server to index.ts
Add to the import section:
import { InigoPlugin } from "inigo.js";
Add to the plugins:
const server = new ApolloServer({
  //...
  plugins: [
    InigoPlugin()
  ]
  //...
});
2. Start Apollo Server Using Your Inigo Token
Using the Inigo token copied from the setup process, add it to an INIGO_SERVICE_TOKEN environment variable. You can then start the server with npm start.
Lost your Token? You can create a new one under the Actions menu on the main Inigo dashboard screen.
export INIGO_SERVICE_TOKEN="paste the token here"

npm start
You may see
infologs coming from the Inigo agent after you start the application. You can ignore these logs unless you happen to run into a problem.
3. Configure and Use Inigo Explorer
While you can use Apollo Studio, we recommend Inigo Explorer as a web based interface to execute, save, and share GraphQL queries. Please follow the steps to configure Explorer:
- In your browser, go to http://app.inigo.io, go to your Service, and click the Explorer tab
- Click on the Gear icon for the Connection settings
- Add
http://localhost:4000as the Endpoint (see the following screenshot)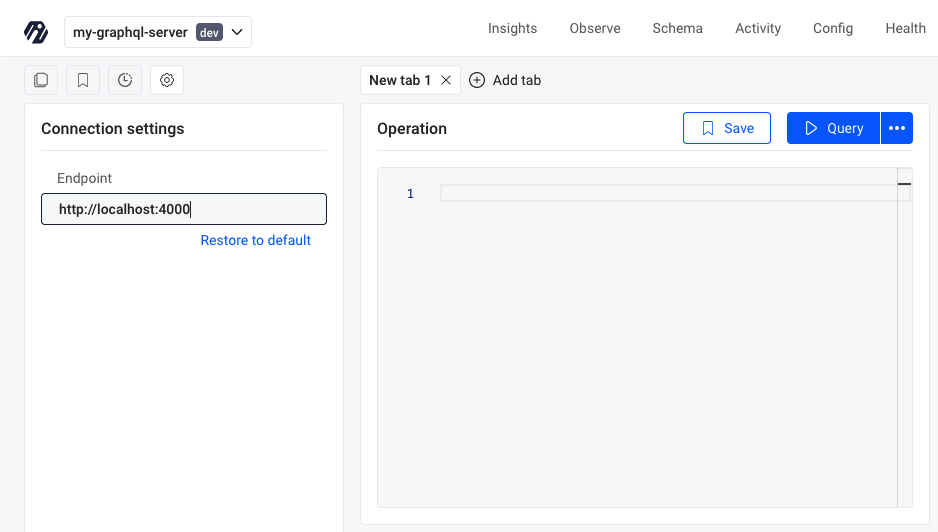
- You can now click back to the Query builder (lefthand icon) to continue
In Explorer, you can now run some sample queries against the Star Wars schema. The application already contains GraphQL resolvers and hard-coded sample data.
4. Execute Sample GraphQL Queries
Here are three sample GraphQL queries that you can use for testing:
query Films {
  films {
    title
  }
}
query FilmsAndCharacters {
  films {
    title
    characters {
      name
    }
  }
}
query FilmsAndCharactersAppearedIn {
  films {
    title
    characters {
      name
      appearedIn {
        title
      }
    }
  }
}
The queries can be run in Inigo Explorer as shown in the following screenshot. Click on each query and run separately:
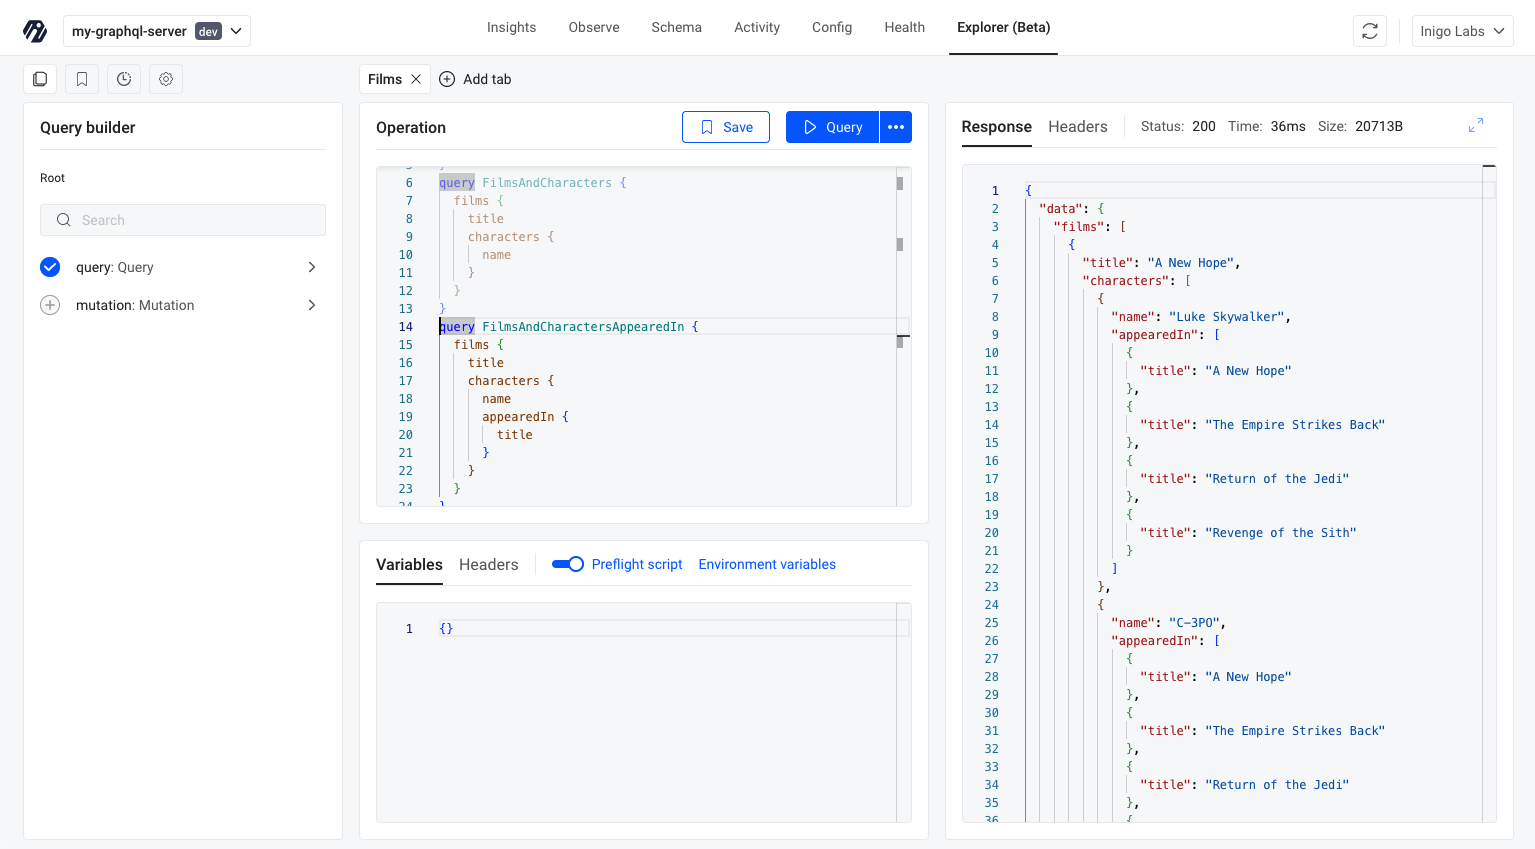
Please run these queries several times. This will populate the Inigo Observe dashboard with data resulting from the execution of these queries.
5. Try the Inigo Observe Dashboard
Inigo Observe enables you to drill down into the metrics of your queries and understand how to improve the performance of your GraphQL services. Additionally, you can analyze and understand the error scenarios that your application is facing.
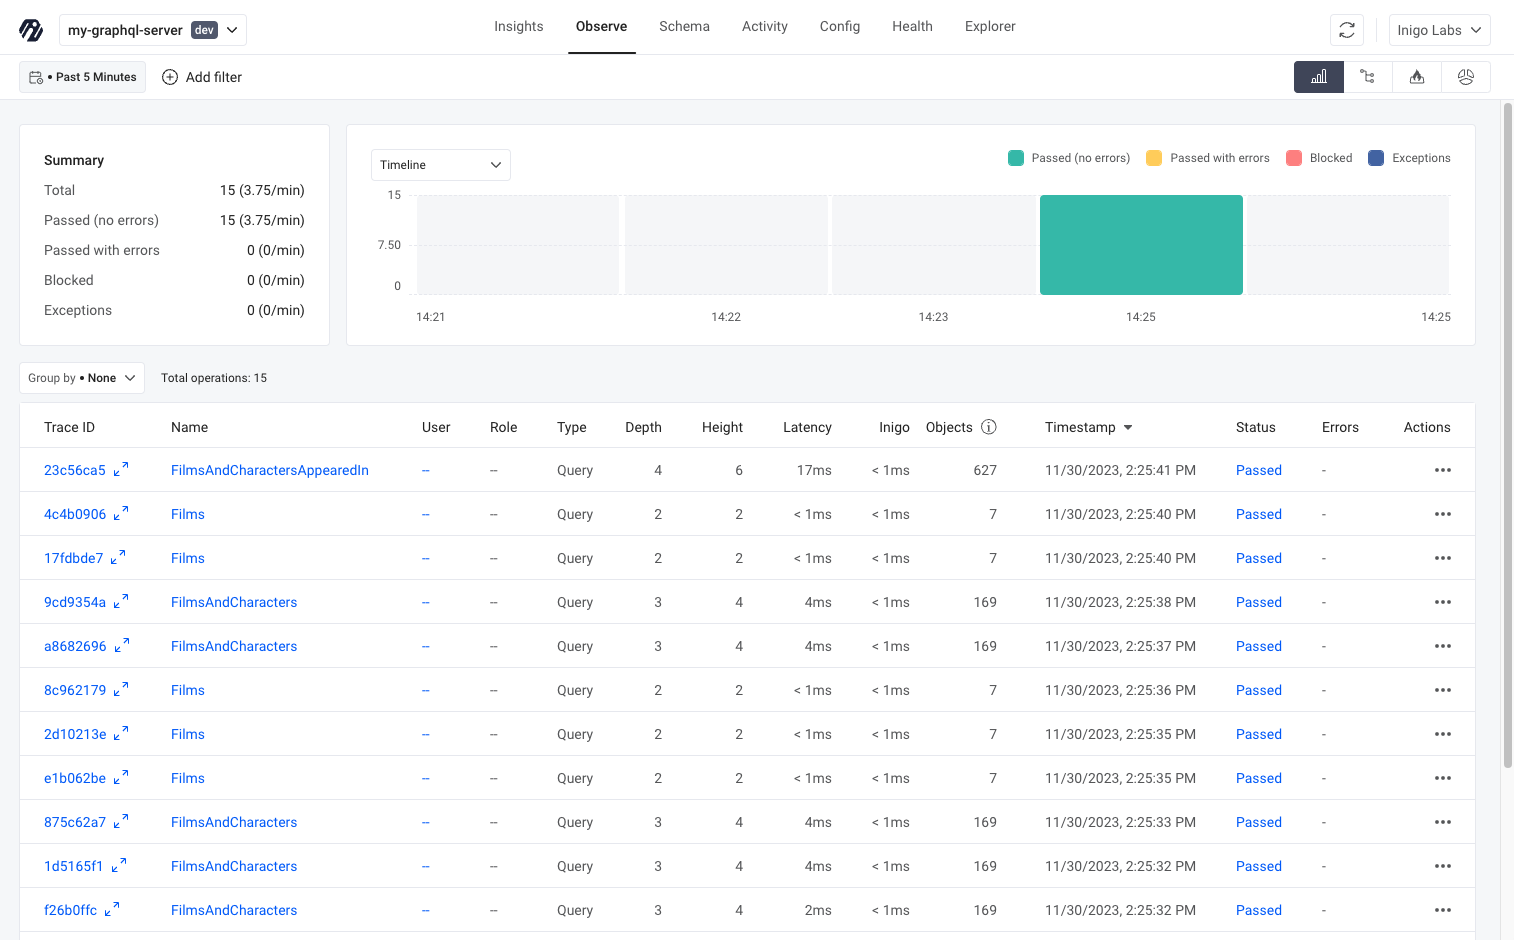
Inigo Observe Charts
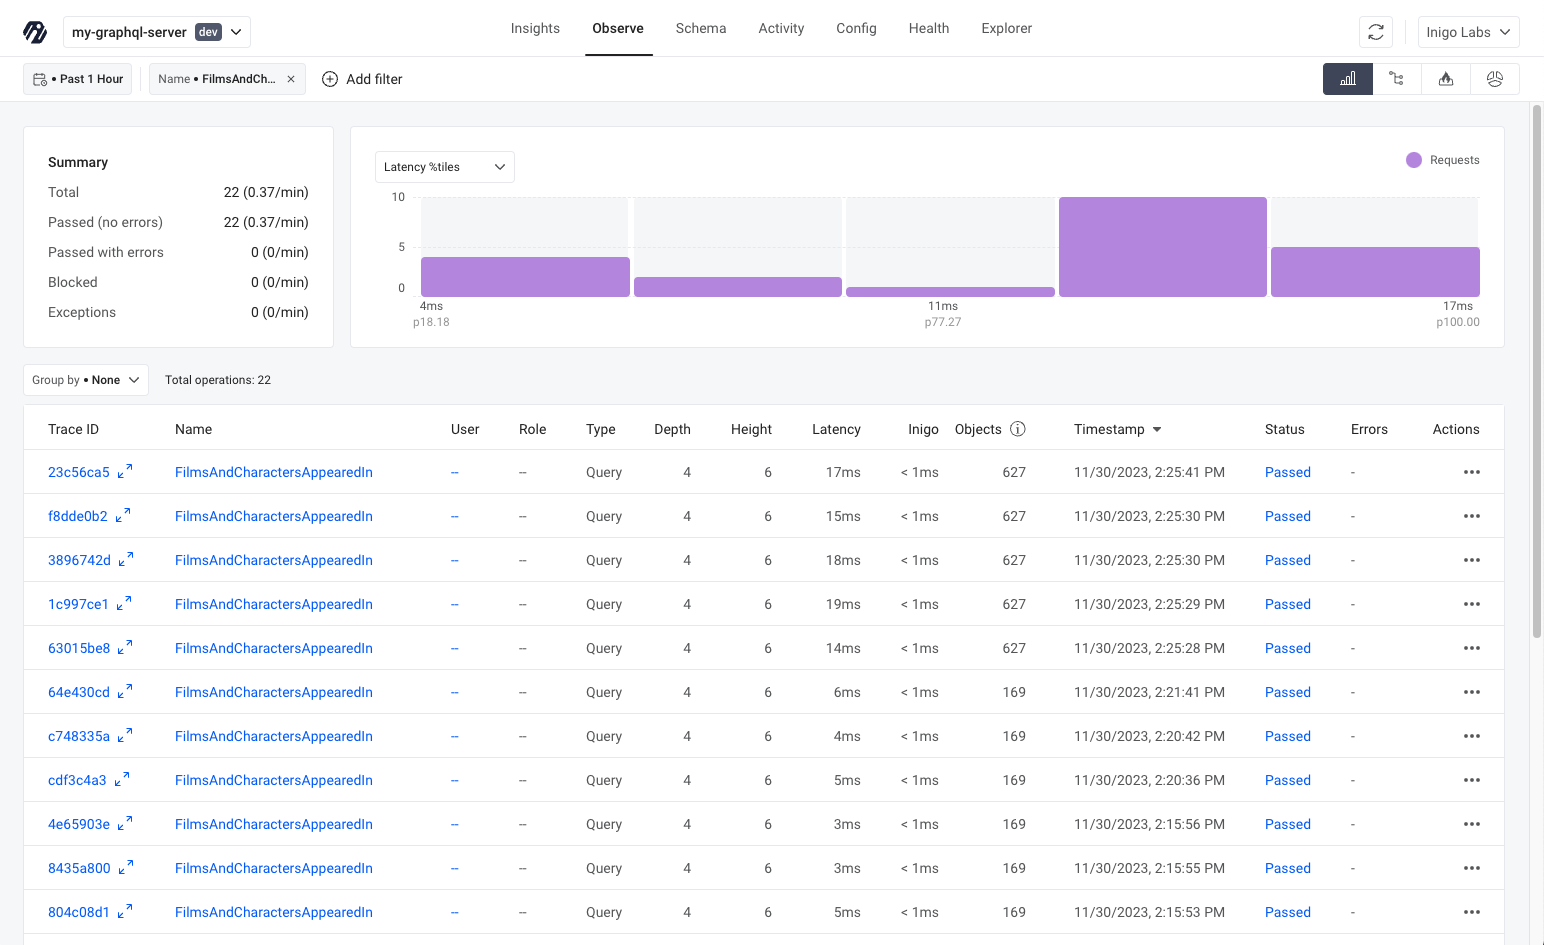
Click on Observe (top menubar). You should see the queries that you just executed from Explorer. If not, please wait a moment and click the Refresh button (top right).
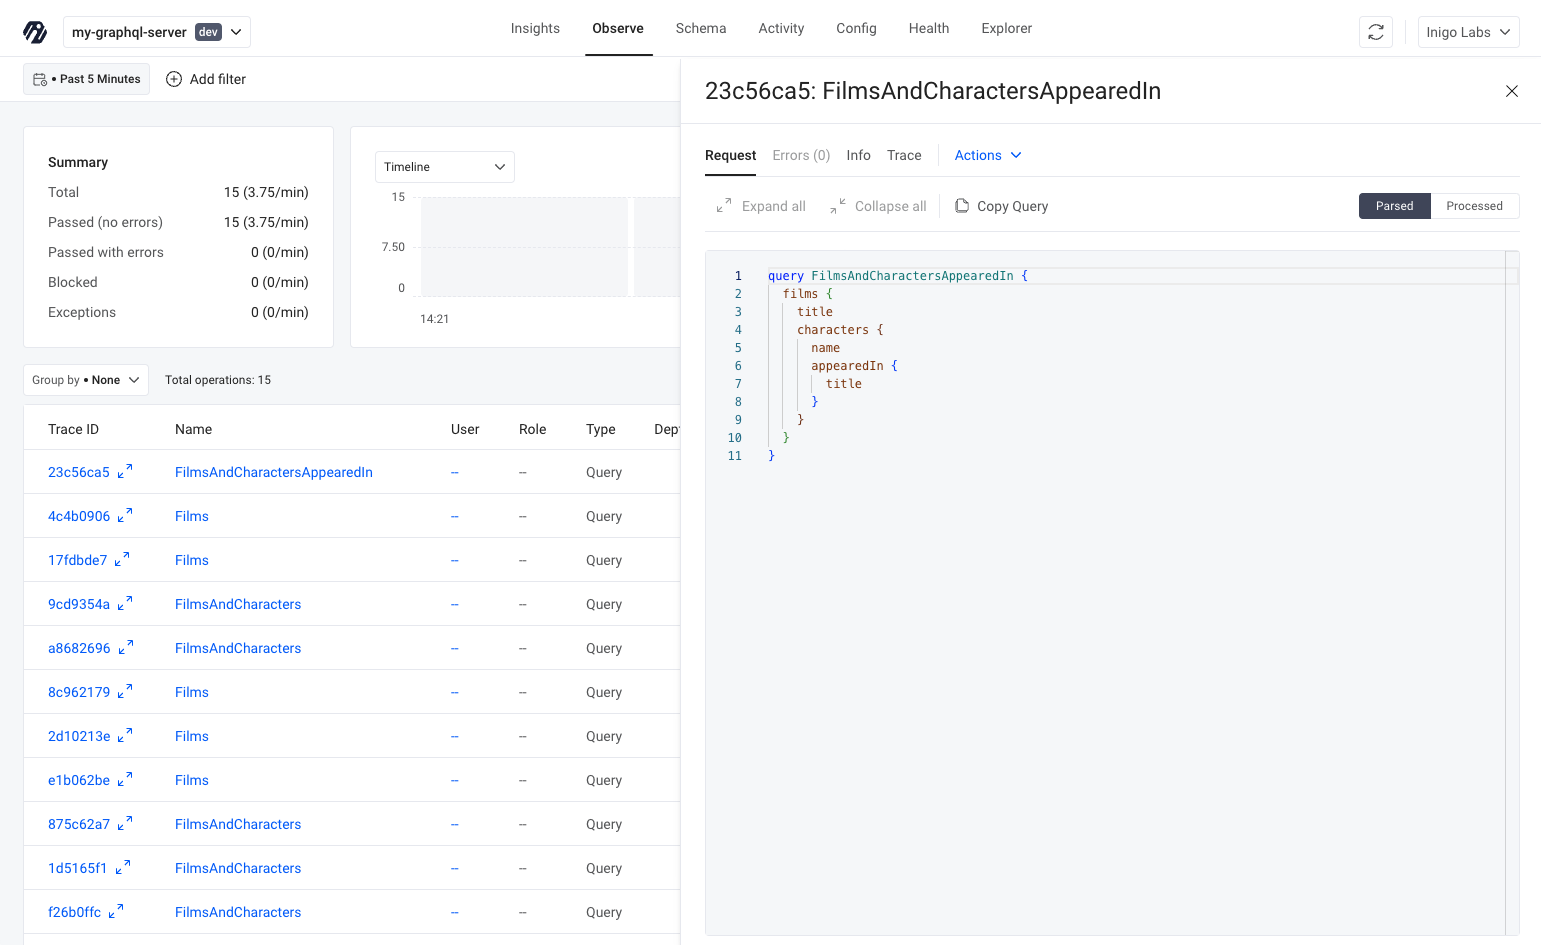
Next, click on the Trace ID for FilmsAndCharactersAppearedIn in the bottom pane. A pane will slide from the right side showing the GraphQL query that was executed under the Parsed tab. Click X to exit the right-side pane.
Next, in the upper-right pane, select Latency %titles from the dropdown menu. A bar chart will show a breakdown of request latencies across all FilmsAndCharactersAppearedIn queries.
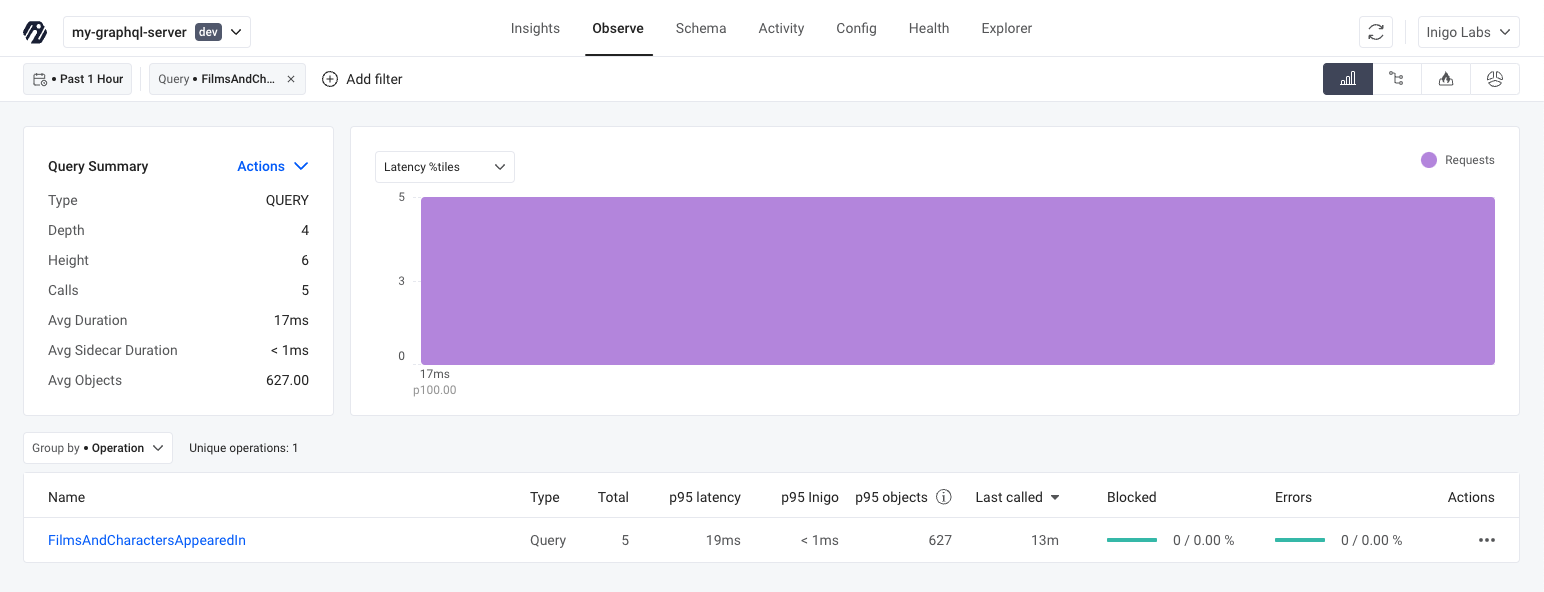
Next, in the middle-left menu, click Group by and select Operation. Now, in the bottom pane, you will see additional metrics on the FilmsAndCharactersAppearedIn, such as the total # of requests, p95 latency, and percentages of requests that were blocked or had errors.
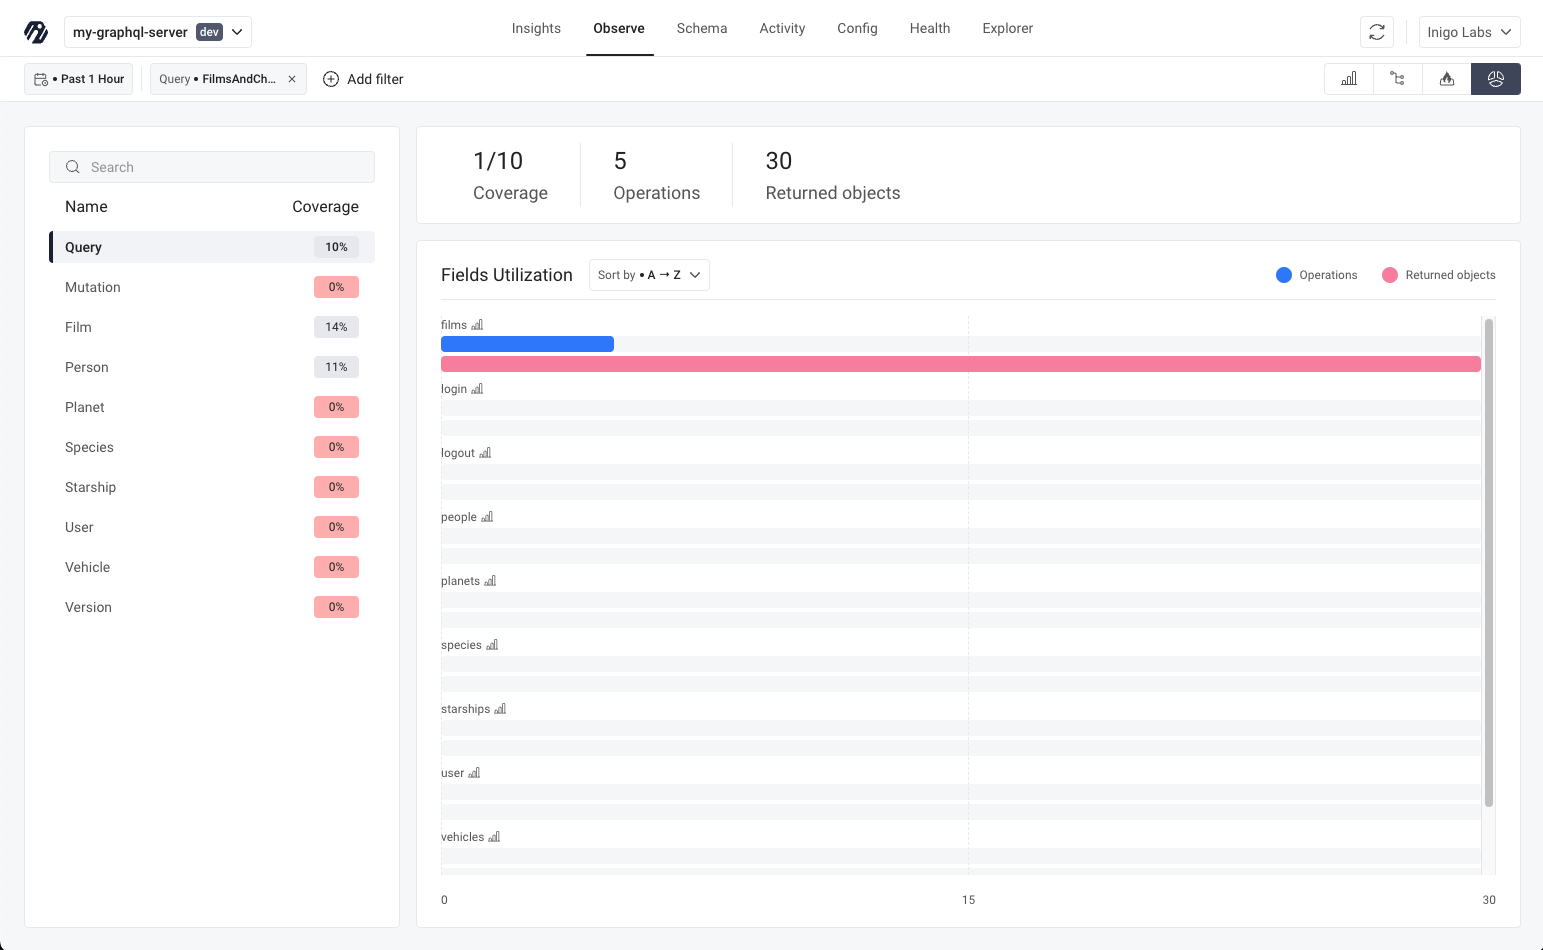
Inigo Observe Coverage
On the upper right, click the Coverage button (Pie Chart Icon). This screen shows you a breakdown of what objects were returned across all of the FilmsAndCharactersAppearedIn queries.
Conclusion
Congratulations! You have successfully installed the Inigo agent and configured your Inigo token for the Star Wars Demo Application. Additionally, you have now observed metrics being displayed in Inigo Observe.
You may proceed to the remainder of the tutorials to learn more about the features of Inigo!